This is a very quick tutorial to show you:
How to generate a custom drive function such as a chirp for example
How to input that in OnScale
Generating a Chirp drive function
To generate quickly a drive function such as chirp, nothing is better than using the scipy signal python module
Here’s a description of the chirp function implemented in Scipy
I like to use Jupyter notebook to work with python and process data easily.
The code is here:
https://github.com/CyprienRusu/Feaforall/blob/master/draw_chirp.ipynb
Here’s the script I defined:
from scipy.signal import chirp
import numpy as np
import matplotlib.pyplot as plt
import pandas as pd
from scipy.fftpack import ifft
%matplotlib inline
t = np.arange(0, 7e-5, step=2e-7)
f1 = 1e6
t1 = 7e-5
f0 = 2e6
ch = chirp(t,f0,t1,f1)
#This is only for vizualization
chart1 = plt.plot(t,ch)
plt.xlabel('Time t')
plt.ylabel('Chirp(Hz)')
plt.axis([0,7e-5,-1,1])
plt.show()
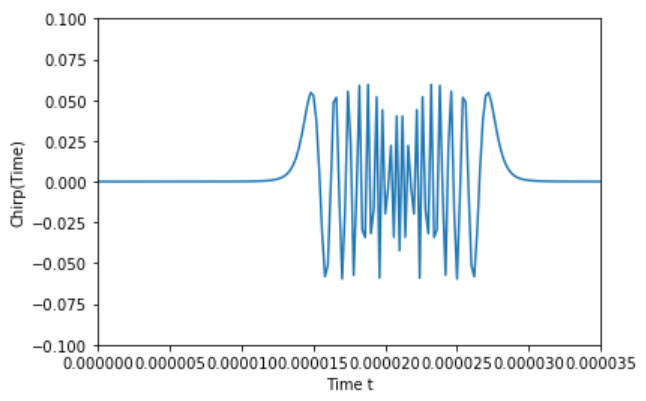
tch = ifft(ch)
#Also for vizualization
chart1 = plt.plot(t.real,tch.real)
plt.xlabel('Time t')
plt.ylabel('Chirp(Time)')
plt.axis([0,3.5e-5,-0.1,0.1])
plt.show()
Tchirp = pd.DataFrame(tch.real,t.real)
Tchirp = Tchirp[:3.5e-5]
Tchirp.to_csv('chirp.dat',sep=" ",header=False)Note: You will need to install scipy, matplotlib, numpy and pandas to run that code
Here’s what you will get:
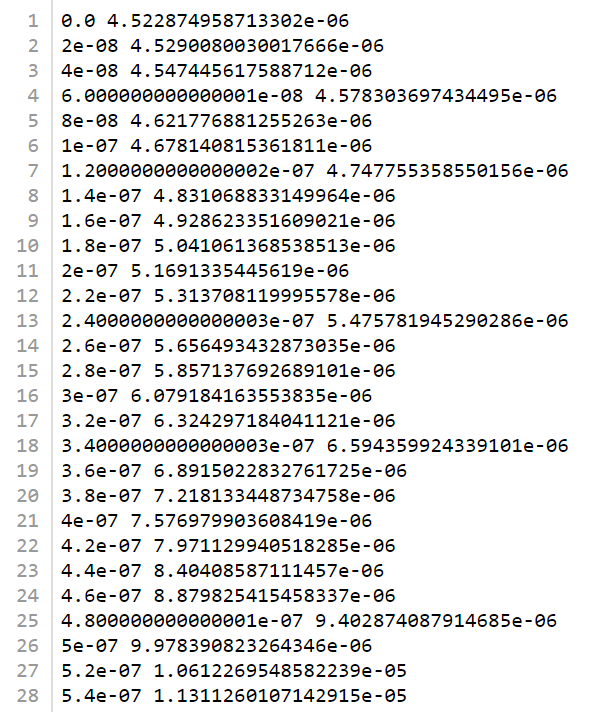
You can download that text file here
How to input this user-defined drive function for the electrode in OnScale?
The general way to define an input drive function is to define a text file formatted with 2 columns and a space in between, like the previous chirp function.
If you have your data in 2 Excel Columns, then you can export them in a Formatted Text (Space delimited) text file
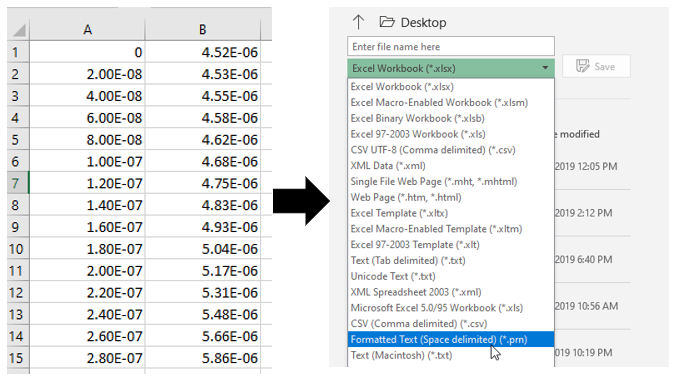
Then change the extension of the text file to “.dat”
The way to import those data in OnScale is then straightforward:
- Create a new drive function
- Choose a “User-Defined” Drive function
- Choose your Space Delimited “.dat” text file containing the data
- Click on Insert

After that, select the drive function (1) and make sure that the Max Frequency (Hz) is defined (2) in the property window
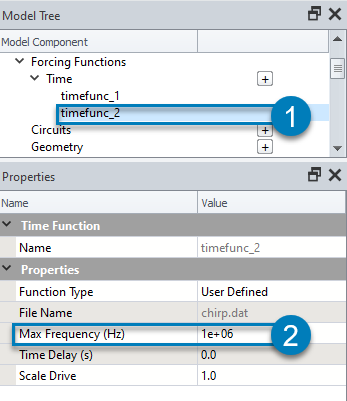
You can then Assign this new user-defined drive function to the electrode of your transducer model in the property window

The tutorial for this model is available here
That’s all! Let me know in the comments if you have some questions.
–Cyprien

Leave a Reply